


The Corner of East London with the Most Swimming Pools Per Person
How many Londoners could cool off during the sweltering summer of 2022?


Water in London was a hot topic this summer.
It was a hot topic because of the heat and the drought. London was officially declared in a drought on 12 August. Thames Water introduced a hosepipe ban two weeks later. The ban is still in force despite the cooler, wetter September we have just had.
This hosepipe ban means you can’t use a hosepipe to fill up swimming pools, if you have one. But how many people have had a swimming pool in their back garden to cool off during this sweltering summer?
Towards an estimate of London’s swimming pools
To answer this question I turned to the London Datastore’s blue green cover data. This processed satellite imagery and other data to provide estimates for the proportion of land in the capital covered by parks, trees and water.
Unfortunately this data does not tell you what the body of water is. I came up with a methodology to filter out bodies of water unlikely to be swimming pools. This methodology was based on:
Removing water that is known to be lakes, rivers and streams.
Removing bodies of water that are likely to be the wrong size to be a man-made pool.
Removing bodies of water too far from buildings.
Removing bodies of water that are known to be in public places, used for industry, in schools and other non-residential locations.
A full description of the methodology is given at the bottom of this post.
What are we left with?
Bodies of water that look a lot like swimming pools.
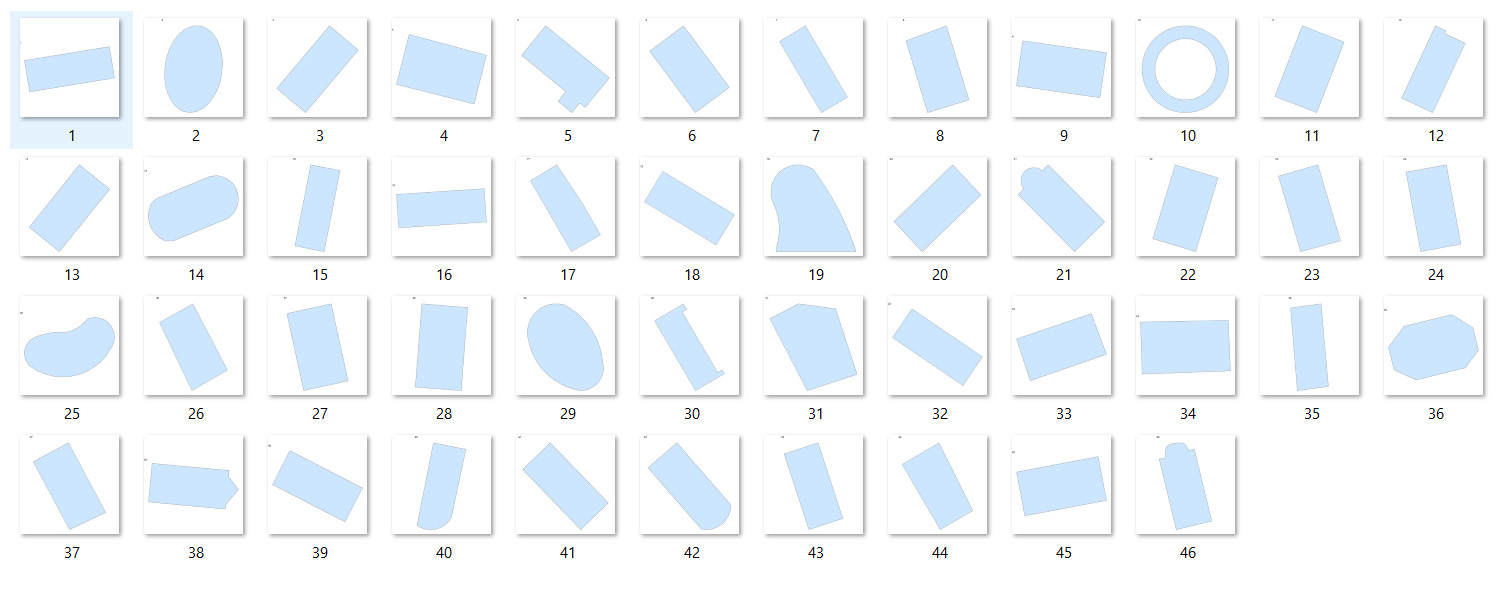
Here is a 1% sample of our possible pools chosen at random and plotted with the coordinates removed. You can see that most of them are regular shapes indicating they are man-made rather than natural. A few even have a characteristic oval or square shape at one end, which indicate some steps down into the pool.
I checked these on Google Maps satellite view and 34 out of 46 I classed as definitely swimming pools. Three were ambiguous and nine did not look to be pools.
This is a success rate of about 74%.
I repeated this test two more times and got success rates of 70% and 72% respectively. These were higher than my earlier tests that got around 60%.
I decided to remove 30% of bodies of water from my sample at random to account for this error rate.
The distribution of London’s swimming pools
According to my sample there are approximately 3,200 outdoor swimming pools in London.
Here they are represented as dots:

The second map shows the concentration of swimming pools across London. The darker the shade of blue, the more there are per person in that neighbourhood.
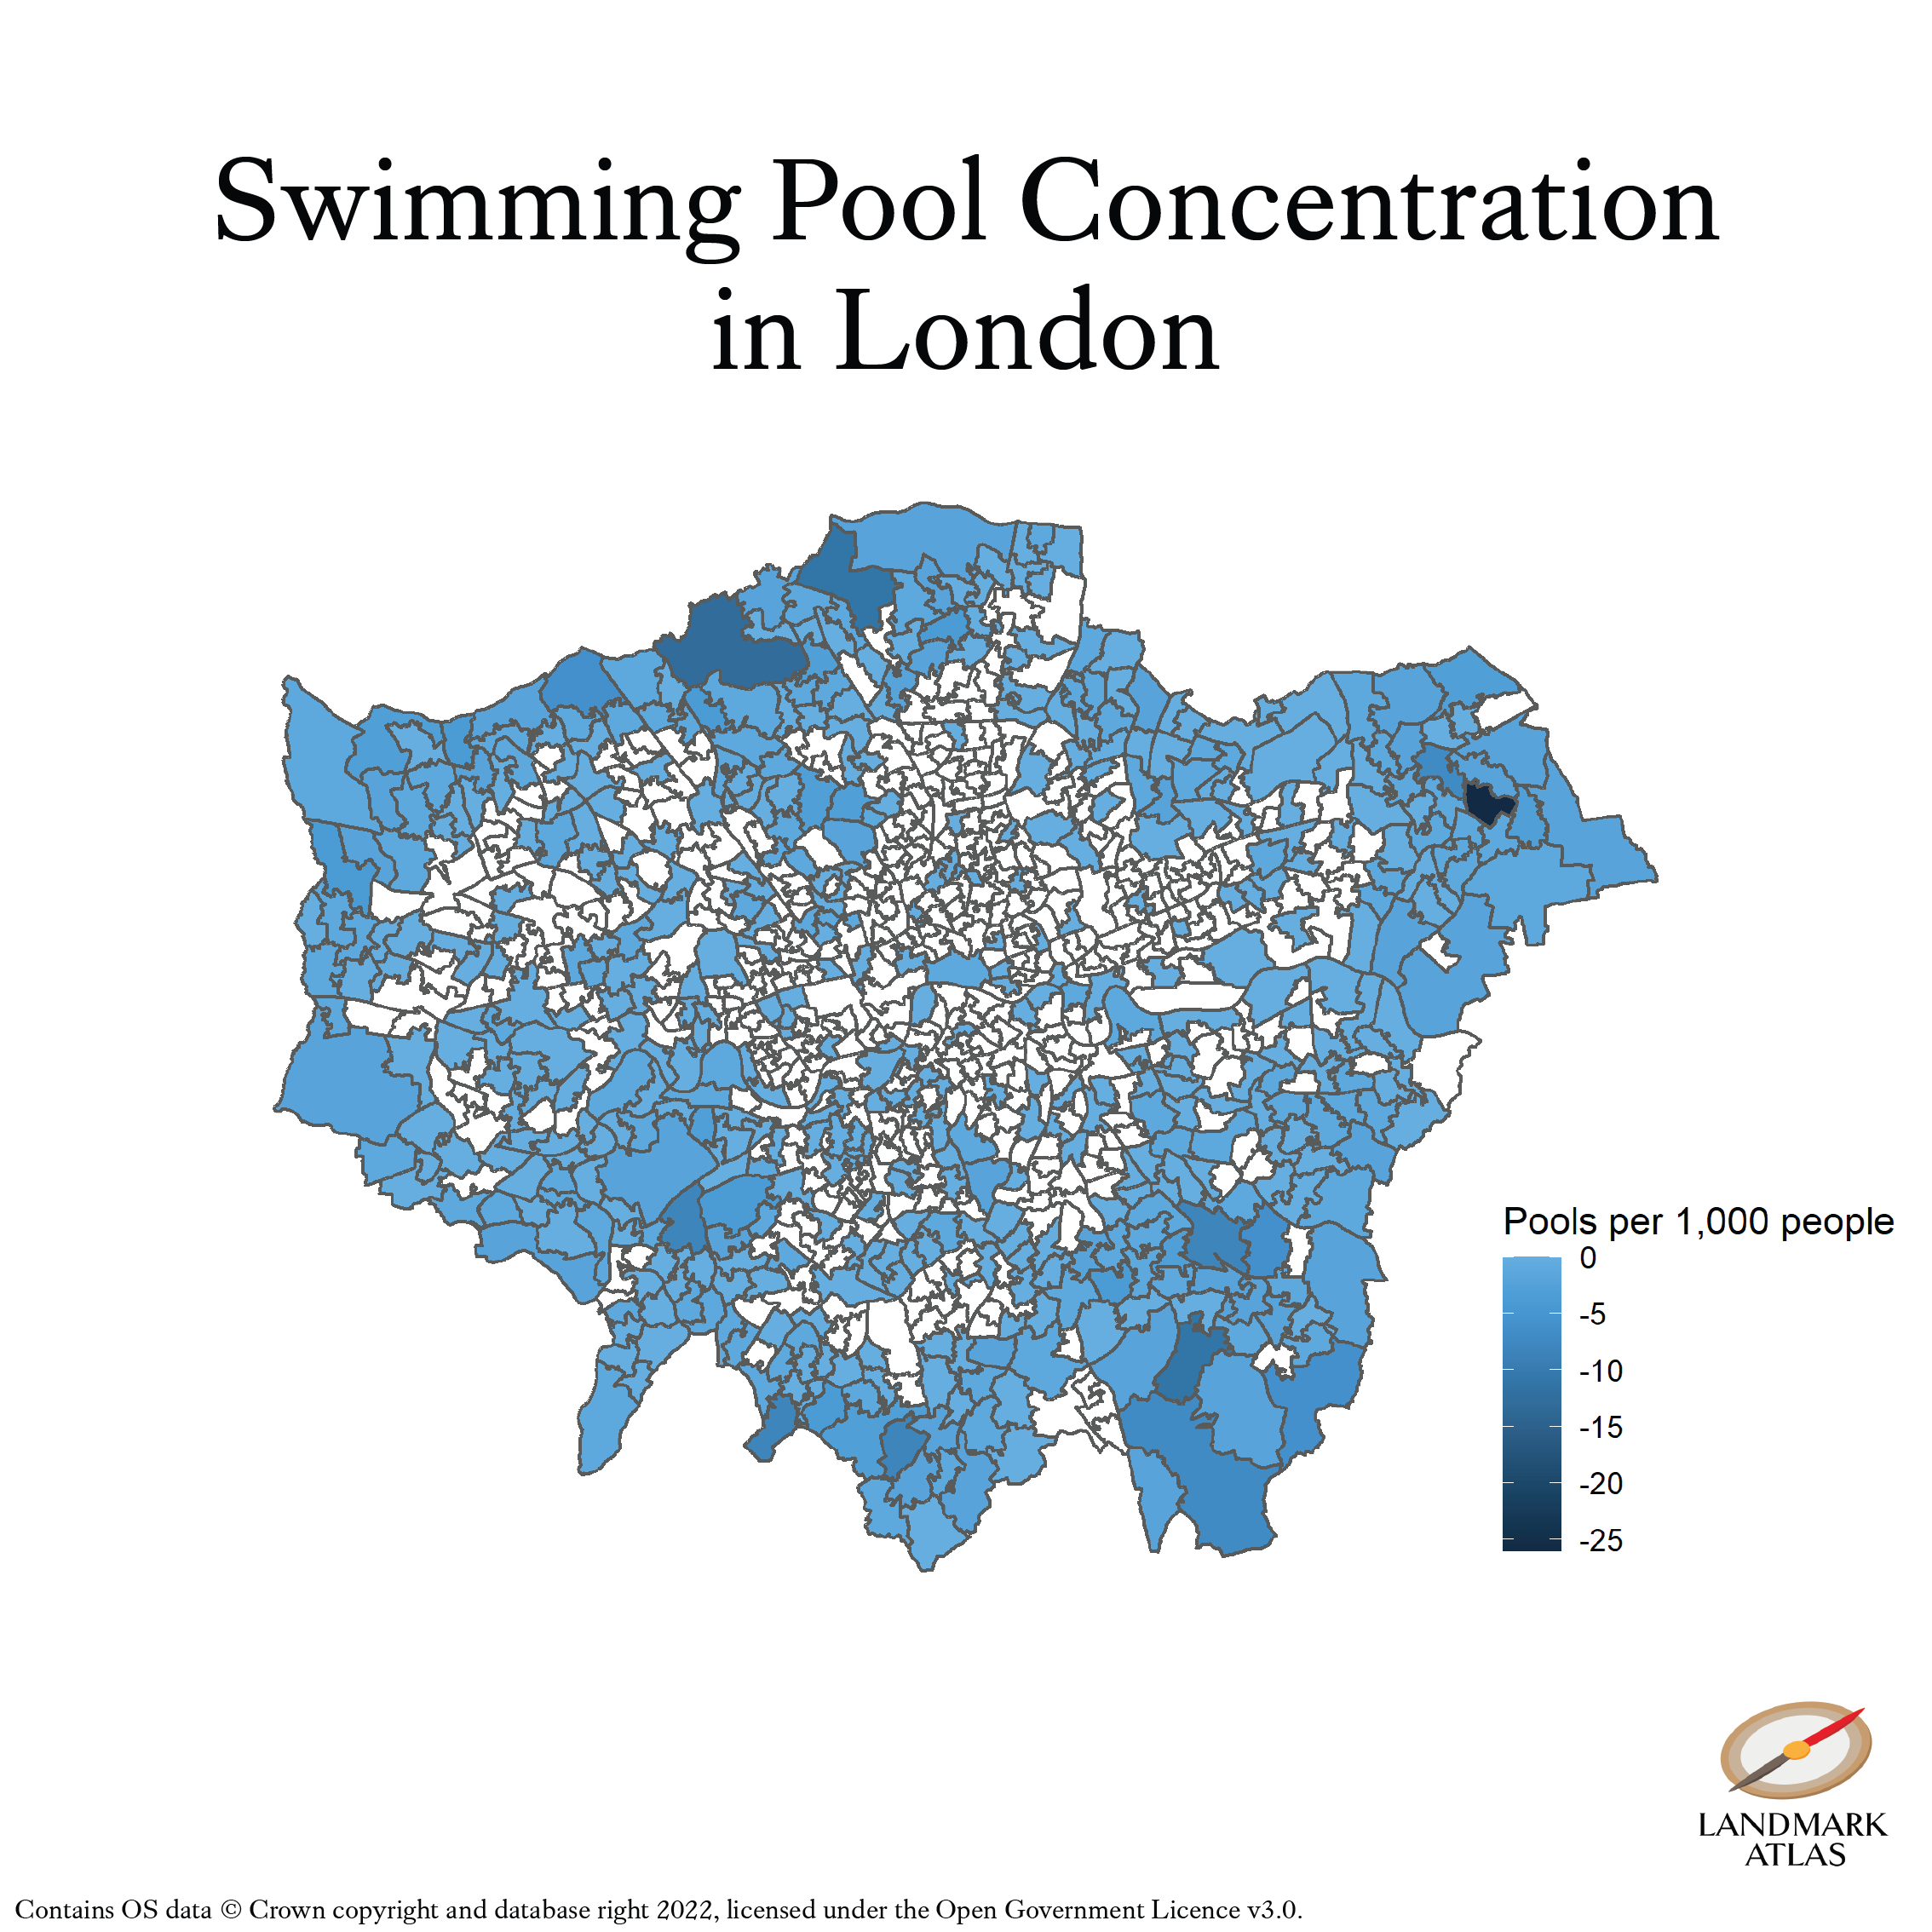
The dark blue spot in the north east is London’s swimming pool capital: Emerson Park.
The neighbourhood near Romford has 26 pools for every 1,000 residents. I had never heard of Emerson Park before researching this piece but its Wikipedia page checks out: it describes the area as ‘historically popular with footballers’.
The white areas on the map are the 490 of London’s 983 neighbourhoods that have, by my estimate, no outdoor pools. These neighbourhoods tend to be inner London, where there are more flats, more social housing and smaller plots of land that are less conducive to installing pools.
People want to swim but costs are rising as well as temperatures
Even before the pandemic, interest in wild swimming was growing in Britain, to judge by Google Trends. The chart below shows this. You can see the seasonality as interest grows in the warmer months with an overall upward trend.

As swimming pools and leisure centres were closed for much of 2020 and 2021 people looked to nature as a way of keeping physically and mentally well.
Hotter temperatures in the future may make a swimming pool a sound investment if you have the money and live in southern England.
But how many people will have the money? Pools are far from cheap to begin with; and as the cost of living crisis bites many families will have to cut back on extravagant purchases.
Rising costs of energy and other materials such as chlorine are affecting commercial pools too. In a sign of how globalised markets are, Pool Magazine reports that a fire in a chemical plant in Louisiana after Hurricane Laura in August 2020 has contributed to a worldwide spike in the price of chlorine.
Perhaps wild swimming will continue to grow in popularity as British people seek a cheap way to cool off in hot summers to come, so long as they are confident there is no sewage in the water.
Methodology
I obtained the ‘blue shapes’ data from the London Datastore. To recap, this is the data judged to be water based on analysis of satellite imagery. This data was read in as shapefiles into R. From there:
I compared it against the Ordnance Survey’s Open Zoomstack dataset and removed blue shapes that intersected with known bodies of water such as rivers and lakes.
I calculated the area of the pools and filtered out ones larger than 200 square metres and smaller than 20 square metres on the basis that these were unlikely to be the right shape to be private pools.
I calculated the width of the bounding boxes (a rectangle that can be drawn around the shape that touches its extremities) and removed ones that were greater than 25m or smaller than 3m in length or width.
I removed blue shapes that intersected with woodland, railways, important buildings or greenspace.
I drew a 20m circle around each blue shape. If it was at least 20m from a building I assumed it was too far from anything to be a pool.
I compared against various Open Street Map data to remove water likely to be used by the likes of industry and apartment buildings.
Commentary on the methodology
I was slightly disappointed with my 70% success score. I had hoped it would be higher.
However, my methodology was very good at getting the blue shapes that you could say perhaps should have been pools. By that I mean bodies of water of the correct size that sit in people’s back gardens. But when I came to check some of these on Google Maps, all I could see were ordinary gardens with no discernible pools or any other bodies of water in them.
Sometimes Google Maps’ satellite resolution was not high enough to discern what exactly I was looking at. Other times the relevant area was obscured by trees.
Still, 70% was the success rate, so I removed 30% of the ‘pools’ from my sample and proceeded on that basis. This means that obviously the dot map of pools around London is not the definitive map. It’s an indication of the distribution of swimming pools across London.
Could I have improved this methodology somehow? Is it up to scratch? If you think so, please comment and let me and your fellow readers know.